Chart
A fast chart built around liquidity and order flow: nearly 30 built-in indicators, drawing tools, three chart types and settings that are saved together with your workspace. The chart is constantly improving.
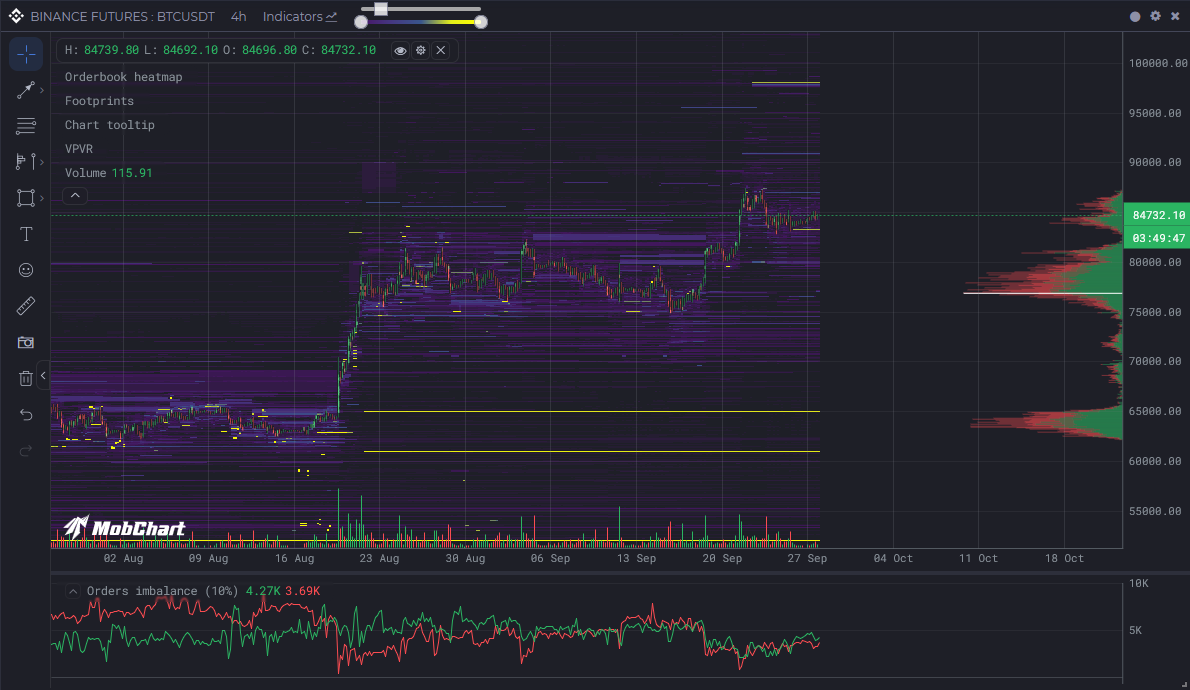
Chart types
The main series is an indicator like any other, so its type and colours live in the indicator settings.
| Type | When to use it |
|---|---|
| Candlestick | The default. Open, high, low and close of every bar. |
| Line | Closes only. Handy on small widgets and for comparing several tickers. |
| Heikin-Ashi | Averaged candles that smooth noise and make trends easier to read. |
Two families of indicators
Main chart indicators
Drawn on top of the price: orderbook heatmap, footprints, volume profiles, Large Trades, moving averages and more.
Panel indicators
Rendered in their own panel under the price: volume, delta, cumulative delta, open interest, funding, MACD, RSI and more.
Every indicator has a Settings tab (what is calculated) and an Appearance tab (how it is drawn). Many indicators can be added several times with different settings, for example two EMAs or several Large Trades filters.