Imbalance screener
Track the imbalance between large buy and sell limit orders and their dynamics. Data updates every 20 seconds.
The screener is based on orders imbalance indicator indicator.
We collect 30 bins data for 1m, 5m, 15m, 1h and 4h timeframes and then generate imbalance charts. Screener table fields are based on that data.
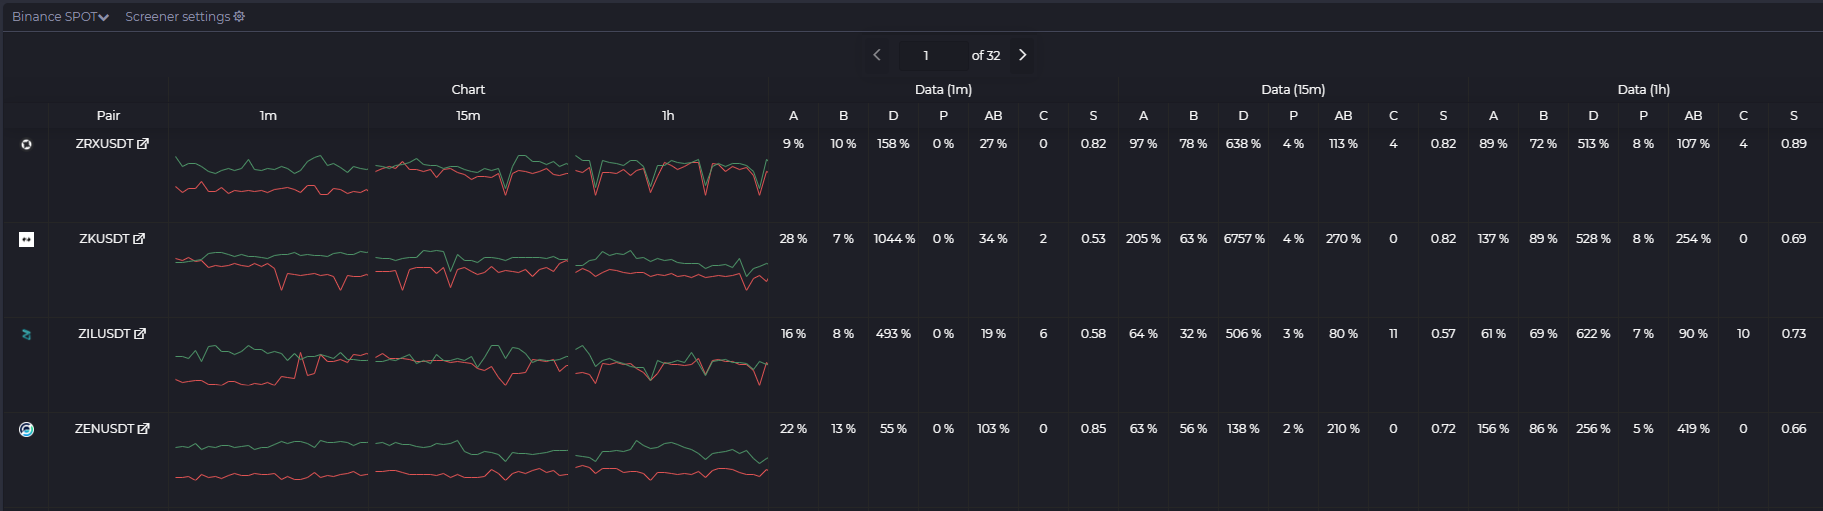
Screener table
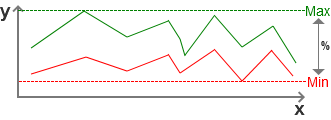
A — Change between max and min Asks sum(%).
B — Change between max and min Bids sum(%).
AB — Change between max sum and min sum of Asks and Bids(%).
D — Change between max and min Asks and Bids delta(%).
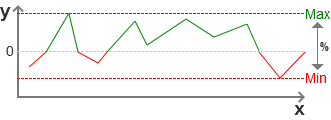
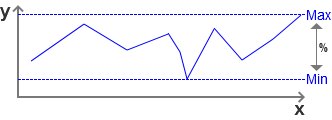
P — Change between max and min price(%).
C — Number of crosses between Asks and Bids sum charts.
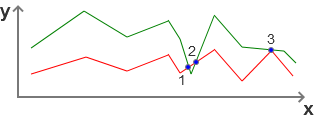
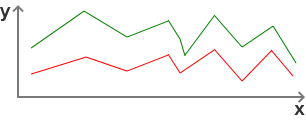
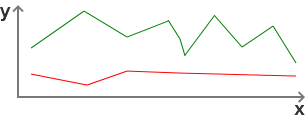
S — Similarity between Asks and Bids sum charts(from 0 to 1).
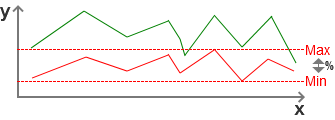
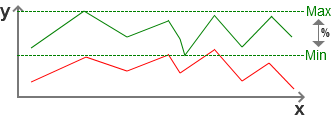
Similar and not similar charts:
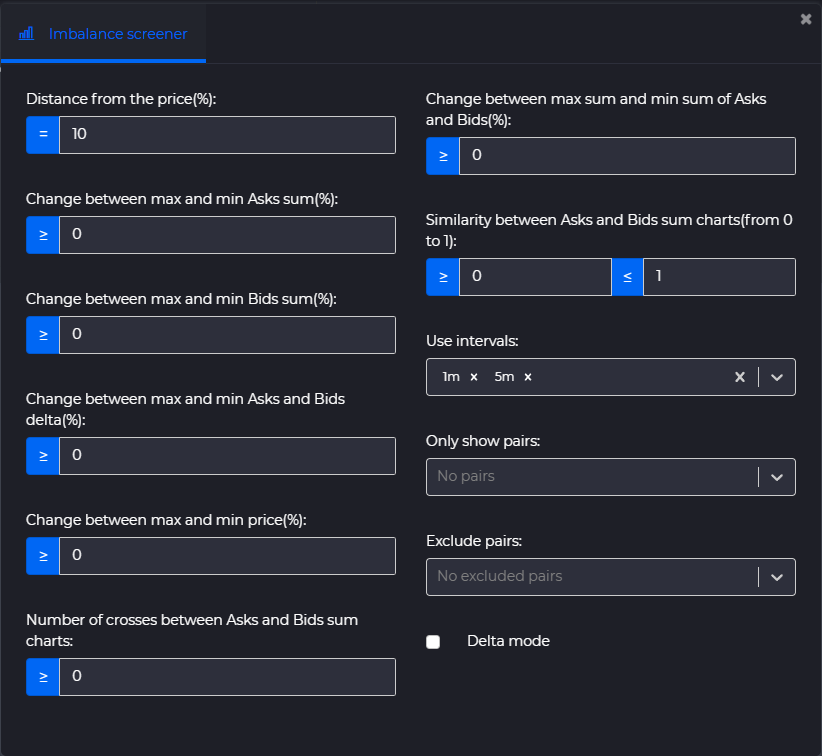
Settings
You can set the screener settings to search for needed situations on the market: