Indicators
There are two types of indicators on the chart:
- Indicators in the form of additional charts (MACD, RSI, etc.)
- Indicators that are displayed on the main chart (EMA, SMA, Heatmap, Footprints, etc.)
This is how the indicator selection window looks like:
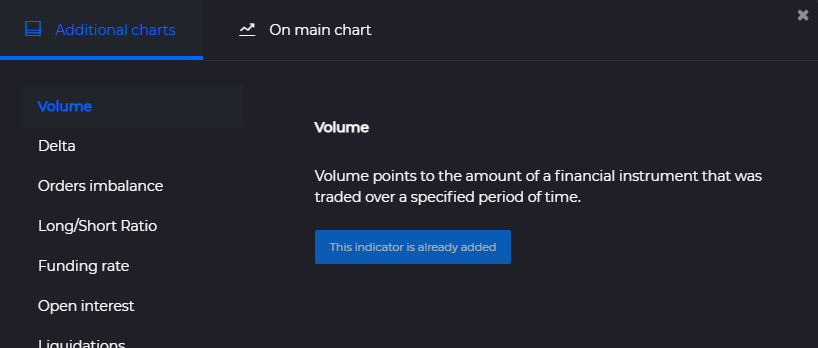
Now let's look at some indicators:
Large Trades
Large Trades are high-volume orders that can influence price and indicate actions of "whales" (large players), market makers, or institutional investors. Analyzing such trades helps predict market movements and identify entry/exit points.
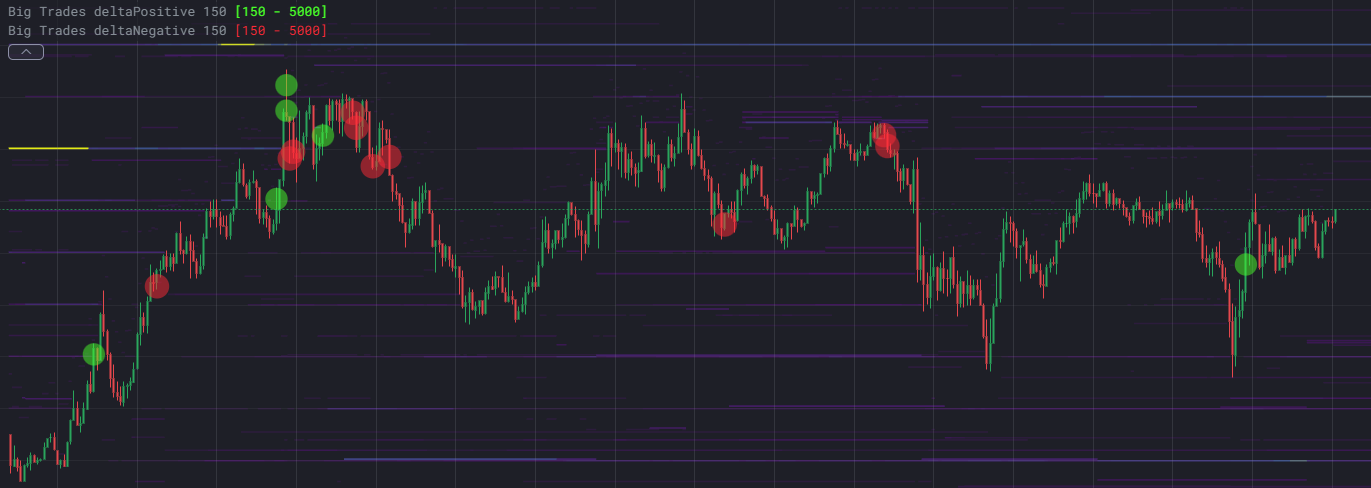
This indicator helps identify large buy/sell orders, delta, or total trading volume.
The example below shows significant positive delta and negative delta volumes ranging from 150 to 5000 BTC:
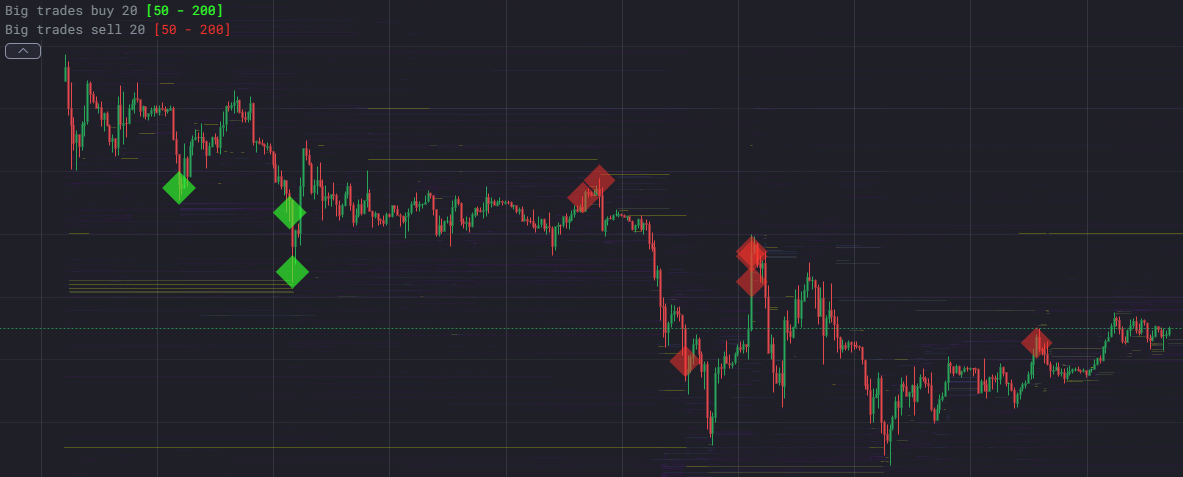
You can configure settings not only for volumes but also for liquidations. For example, here are long/short position liquidations ranging from 50 BTC to 200 BTC:
Delta
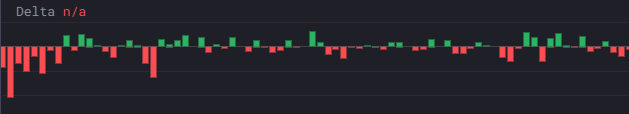
Delta — is the difference between buying and selling power. Volume Delta is calculated by taking the difference of the volume that traded at the offer price and the volume that traded at the bid price. If delta is greater than 0 you have more buying than selling pressure.
This indicator is in the form of the additional chart:
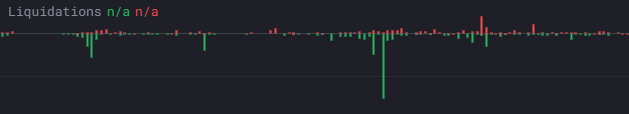
Liquidations
The Liquidation indicator allows you to see the volume that was liquidated, and whether the event happened on the buy or sell side.
This indicator is in the form of the additional chart:
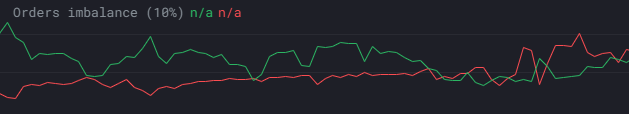
Orders imbalance
Orders imbalance is an indicator that shows the difference between the quantities of buy and sell orders at a specified distance from the price.
This indicator is in the form of the additional chart:
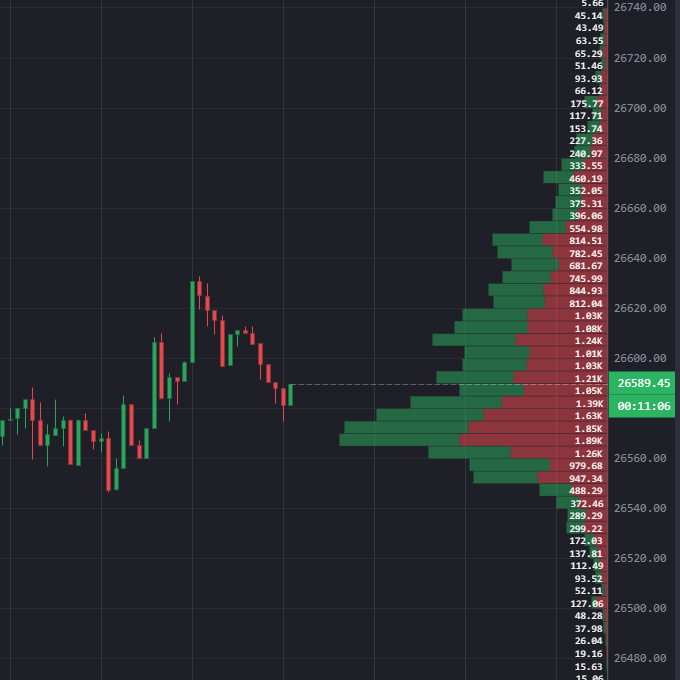
Horizontal volume
Horizontal volume — is an indicator of the interest of traders in a certain price level taking into account all the market transactions for the selected period; i.e., the ongoing accumulation of such transactions on a number of relevant prices.
This indicator is displayed on the main chart:
Footprints
Footprint charts — are a type of candlestick chart that provides additional information, such as trade volume and order flow, in addition to price. This indicator allows you to see not only trading volumes, but also liquidations (on futures).
This indicator is displayed on the main chart:
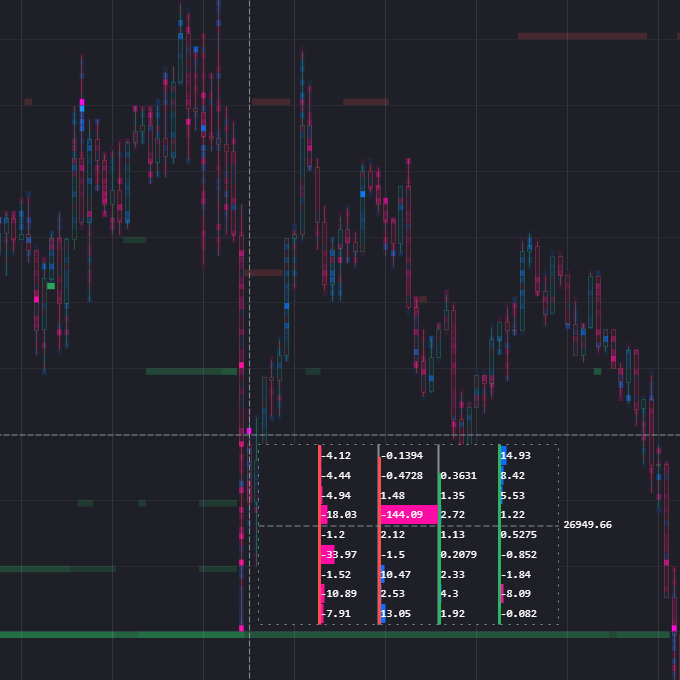
You can learn more about footprints here...