Orderflow analysis
Footrints (Clusters)
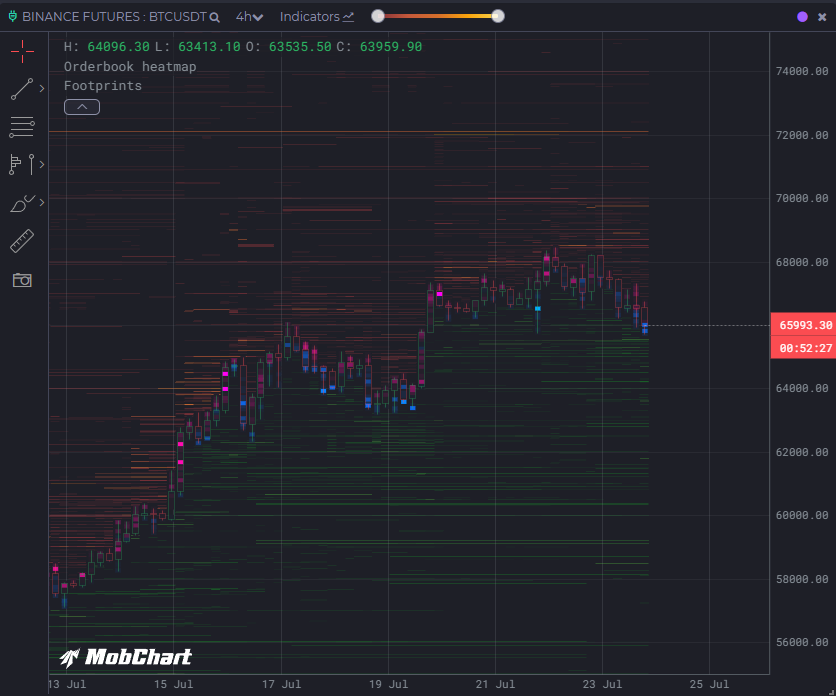
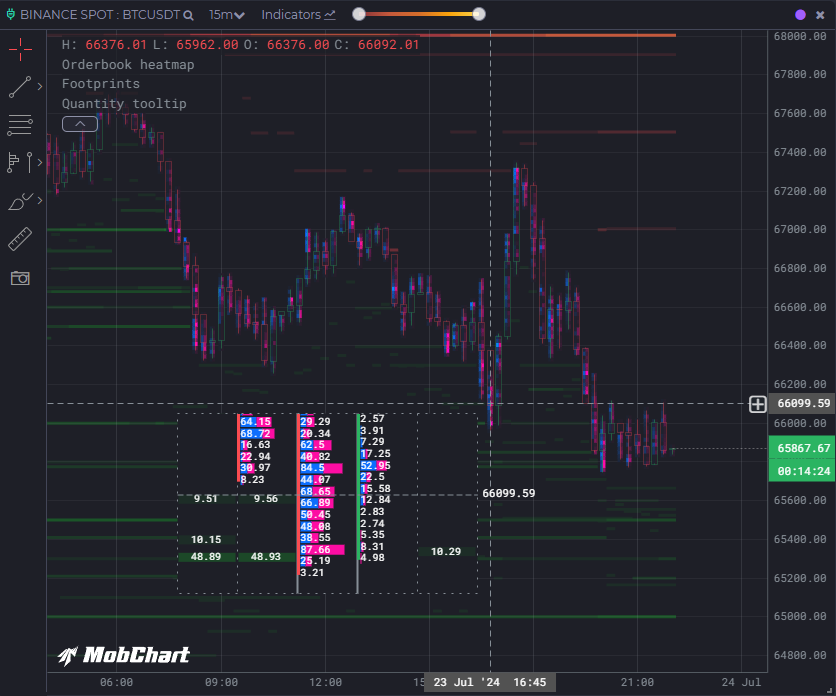
Footprint charts — are a type of candlestick chart that provides additional information, such as trade volume and order flow, in addition to price.
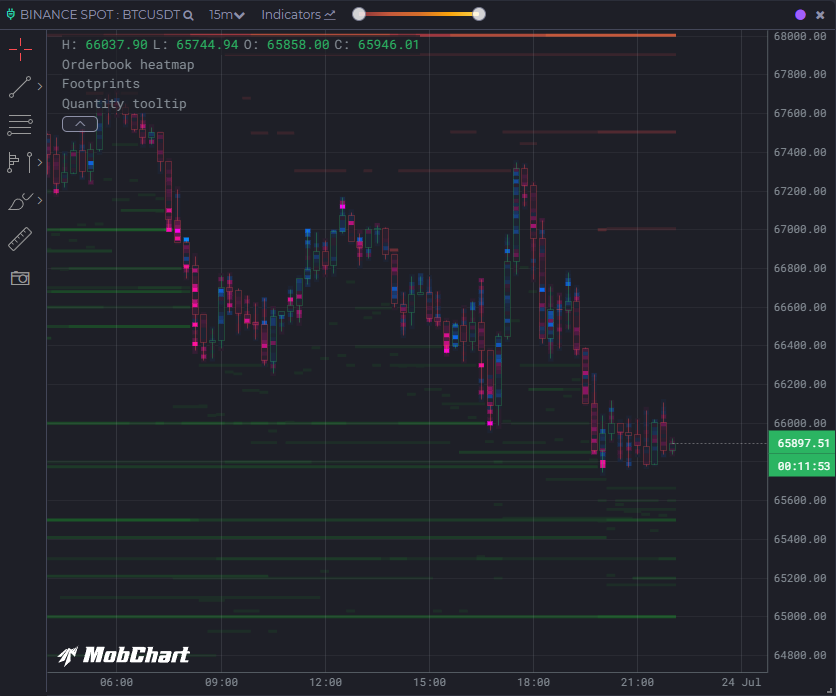
Together with liquidity heatmap you may be able to determine whether the price level highlighted by the Heatmap will act as a price barrier and determine the absorption/exhaustion.
You can set delta mode and color palette. The settings window looks like this:
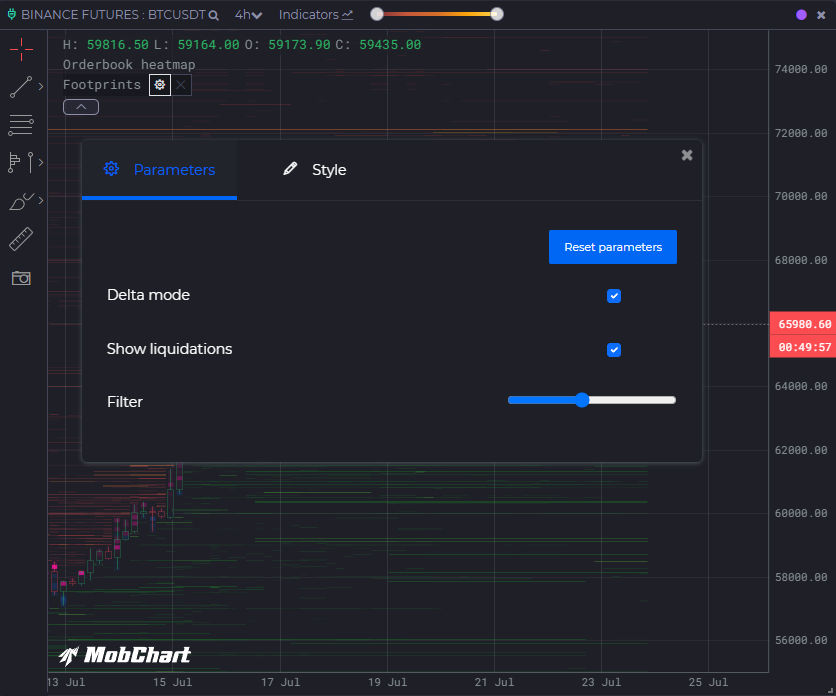
Delta mode
Delta shows the difference between buy and sell volumes. The intensity of the colors in the indicator reflects large and small traded volumes.
Liquidation clusters
You can also track not only buy and sell volumes, but also liquidated volumes of long/short positions.